Dashboard & Reporting
Understand your call tracking analytics dashboard and reporting features.
Dashboard Overview
Your Dashboard is the command center for all your call tracking data. It shows real-time analytics including total calls, answered vs. missed calls, average duration, and call volume graphs. Use the date range picker to compare different time periods.
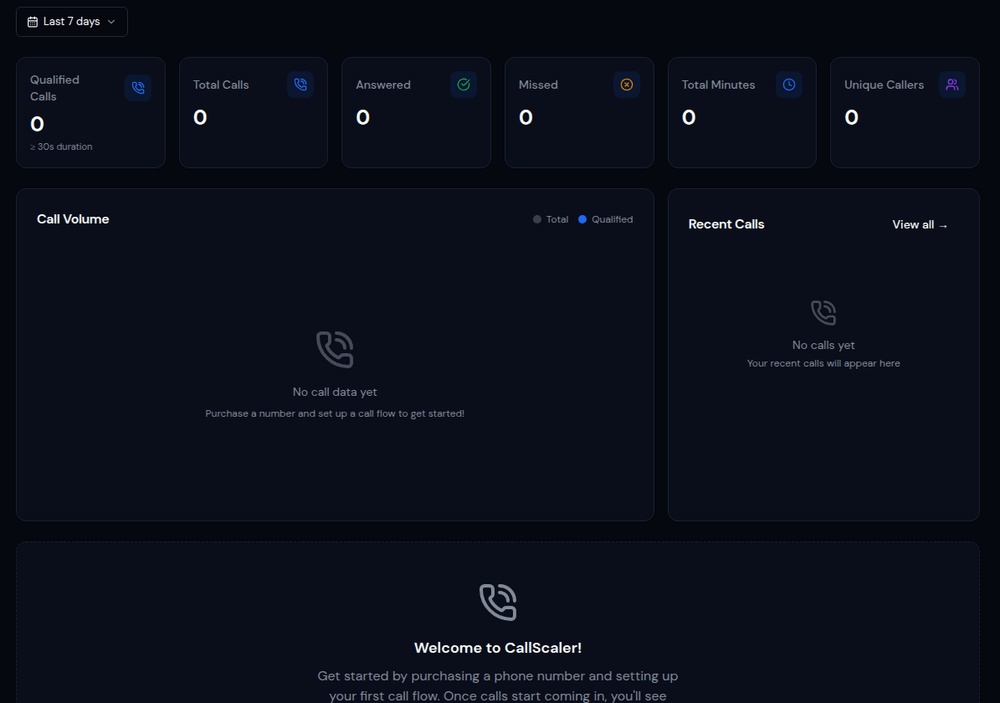
Key Metrics
The dashboard displays several key performance indicators:
- •Total Calls — All inbound calls across all tracking numbers
- •Answered Calls — Calls that were picked up by an agent
- •Missed Calls — Calls that weren't answered
- •First-Time Callers — New callers who haven't called before
- •Average Duration — The average length of answered calls
- •Total Call Duration — Sum of all call durations
Call Volume Charts
The main chart on your dashboard shows call volume over time. Toggle between daily, weekly, and monthly views. Hover over data points to see exact numbers. Compare the current period against a previous period to spot trends.
Source Breakdown
See which marketing sources are generating the most calls. The source breakdown chart shows calls by UTM source (Google, Facebook, Direct, etc.) so you can quickly identify your best-performing channels.
Date Range & Comparison
Use the date range picker at the top of the dashboard to select any time period. Enable the comparison toggle to see how your current metrics stack up against the previous period (e.g., this week vs. last week).