Call Tracking Analytics Dashboard with Real-Time Source Attribution
See call volume, source attribution, lead quality trends, and conversion data — all in real time. Custom date ranges, filters, and breakdowns help you make faster, smarter marketing decisions.
The bottom line
Last updated: February 2026CallScaler's analytics dashboard shows call volume, source attribution, lead quality trends, and conversion data in real time. You can slice data by date range, source, campaign, lead score, and more, then export to CSV or share dashboard links with clients. Multi-business views let agencies see aggregate data or drill into individual clients. Unlike CallTrackingMetrics which restricts advanced reporting to enterprise plans, CallScaler includes full analytics on all plans.
How it works
From raw calls to actionable insights in real time.
Calls Flow In
Every inbound call is logged with source, duration, recording, transcript, AI score, and caller details.
Data Aggregated
CallScaler aggregates call data in real time. Dashboards update live as calls come in.
Filter & Analyze
Slice data by date range, source, campaign, lead score, duration, and more. Custom views for every use case.
Export & Share
Export reports to CSV, share dashboard links with clients, or push data to Google Sheets.
Key capabilities
Slice your call data any way you need.
Real-Time Updates
Dashboard updates live as calls come in. No waiting, no manual refresh.
Advanced Filters
Filter by source, campaign, date range, lead score, duration, status, and custom tags.
Source Breakdown
Pie charts and bar graphs showing call volume by source, campaign, and landing page.
Trend Analysis
See call volume and lead quality trends over time. Spot patterns and anomalies.
CSV Export
Export any report or filtered view to CSV. Your data, your way.
Multi-Business Views
Switch between businesses or see aggregate data across your entire portfolio.
Try Analytics Dashboard free
No credit card required. Set up in under 60 seconds.
Who uses the analytics dashboard?
Anyone who needs to understand call performance and marketing ROI.
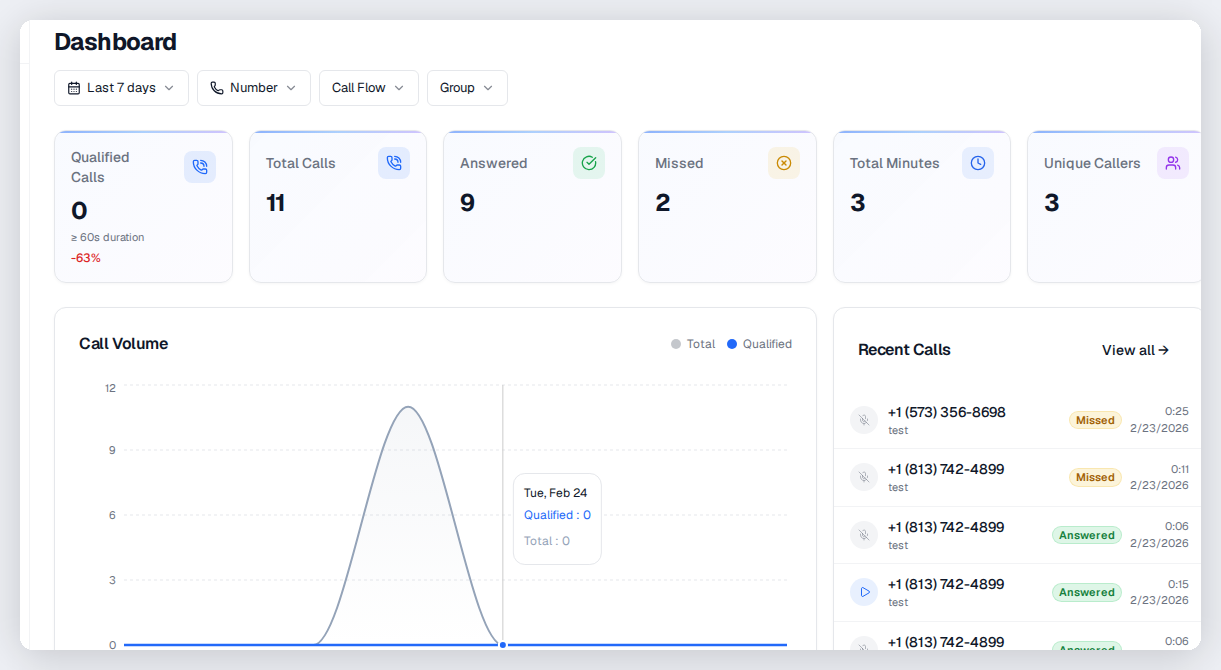
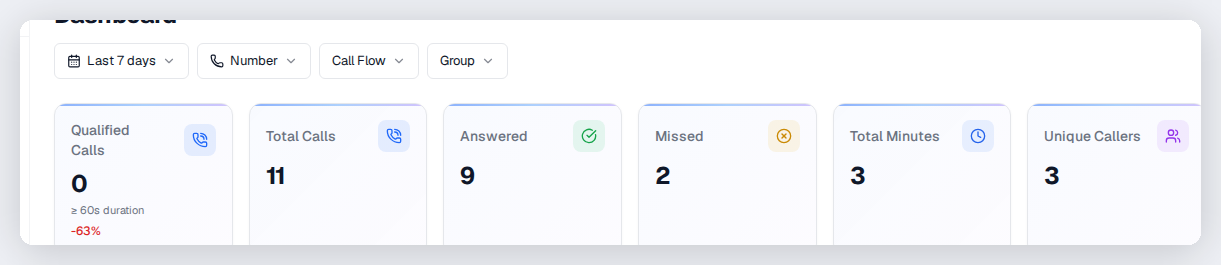
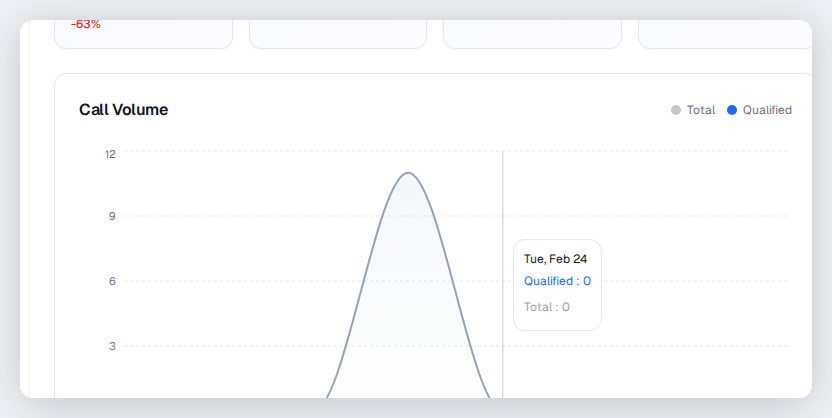
What the dashboard tells you at a glance
The CallScaler dashboard shows your key call metrics in real time: total calls, answered calls, missed calls, unique callers, and qualified leads. Each metric card shows the current value plus the trend compared to the previous period. The call volume chart lets you spot patterns by day of week and identify which days your campaigns perform best. Below the chart, recent calls appear with status badges so you can see what's happening right now.
Source attribution and campaign performance
The dashboard breaks down calls by traffic source so you can see how many calls came from Google Ads, Meta, organic search, direct, and any custom sources you track. You can drill into any source to see individual campaigns, ad groups, and keywords. This is the data you use to decide where to increase spend and where to cut. If your Google Ads calls convert at 3x the rate of your Facebook calls, you can reallocate budget with confidence.
Using filters to find insights
Filter the dashboard by date range, source, campaign, business, lead score, or call status. You can combine filters to answer specific questions. For example, show only qualified calls from Google Ads in the last 7 days, or show missed calls from toll-free numbers this month. Every chart and metric on the dashboard updates to reflect your active filters.
Dashboard for agencies
If you manage multiple clients, the multi-business switcher lets you view each client's dashboard independently or look at aggregate data across your portfolio. This makes it easy to create client-facing reports showing call volume, lead quality, and source performance without switching between accounts.
Customizing your dashboard view
Make the dashboard work for your specific role:
- Use date range presets (today, this week, this month, custom) for quick comparisons
- Save filter combinations you use frequently for one-click access
- Switch between businesses to see individual client performance
- Export any filtered view to CSV for offline analysis or client reporting
Dashboard vs manual reporting
Before call tracking dashboards, marketing teams exported data from multiple sources, built spreadsheets, and spent hours creating reports. CallScaler's dashboard shows the same data in real time with no manual work. Source attribution, lead quality trends, and campaign performance are always up to date. When a client asks 'how are my campaigns doing?' you can answer in seconds instead of building a report.
Key metrics to monitor daily
Build a daily review habit around these dashboard metrics:
- Total calls and unique callers — is volume trending up or down?
- Answer rate — are you missing too many calls?
- Average lead score — is traffic quality consistent or declining?
- Top sources — which campaigns are driving the most calls today?
- Missed calls — which leads need immediate callback follow-up?
Connecting dashboard data to ad platforms
The dashboard shows you which campaigns work. The ad platform integrations close the loop by feeding that data back. When you see a Google Ads campaign with a high average lead score on the dashboard, you know the integration is sending those qualified calls as conversions to Smart Bidding. The dashboard is your monitoring layer; the integrations are your optimization layer. Together, they create a feedback loop that improves campaign performance automatically.
Frequently asked questions
Common questions about Analytics Dashboard.
Related features
Works great with Analytics Dashboard.
Call Reports & Exports
Generate detailed call reports filtered by date, source, campaign, lead score, and more. Export to CSV with all call data including recordings, transcripts, and AI summaries. Schedule automated reports delivered via email or webhook.
Learn moreLead Scoring
AI listens to every call and assigns a lead score from 0 to 100 based on the conversation. Filter your call log by score, send high-value leads to your CRM, and focus your team on the opportunities that matter.
Learn moreKeyword-Level Tracking
Capture gclid, msclkid, fbclid, and UTM parameters automatically. Know which keywords, ad groups, and campaigns generate phone calls — and feed that data back to your ad platforms for smarter bidding.
Learn moreReady to try Analytics Dashboard?
Sign up free and get started in under 60 seconds. No credit card required.